CSNAP (Chemical Similarity Network Analysis Pull-down) Web
Input Ligands:
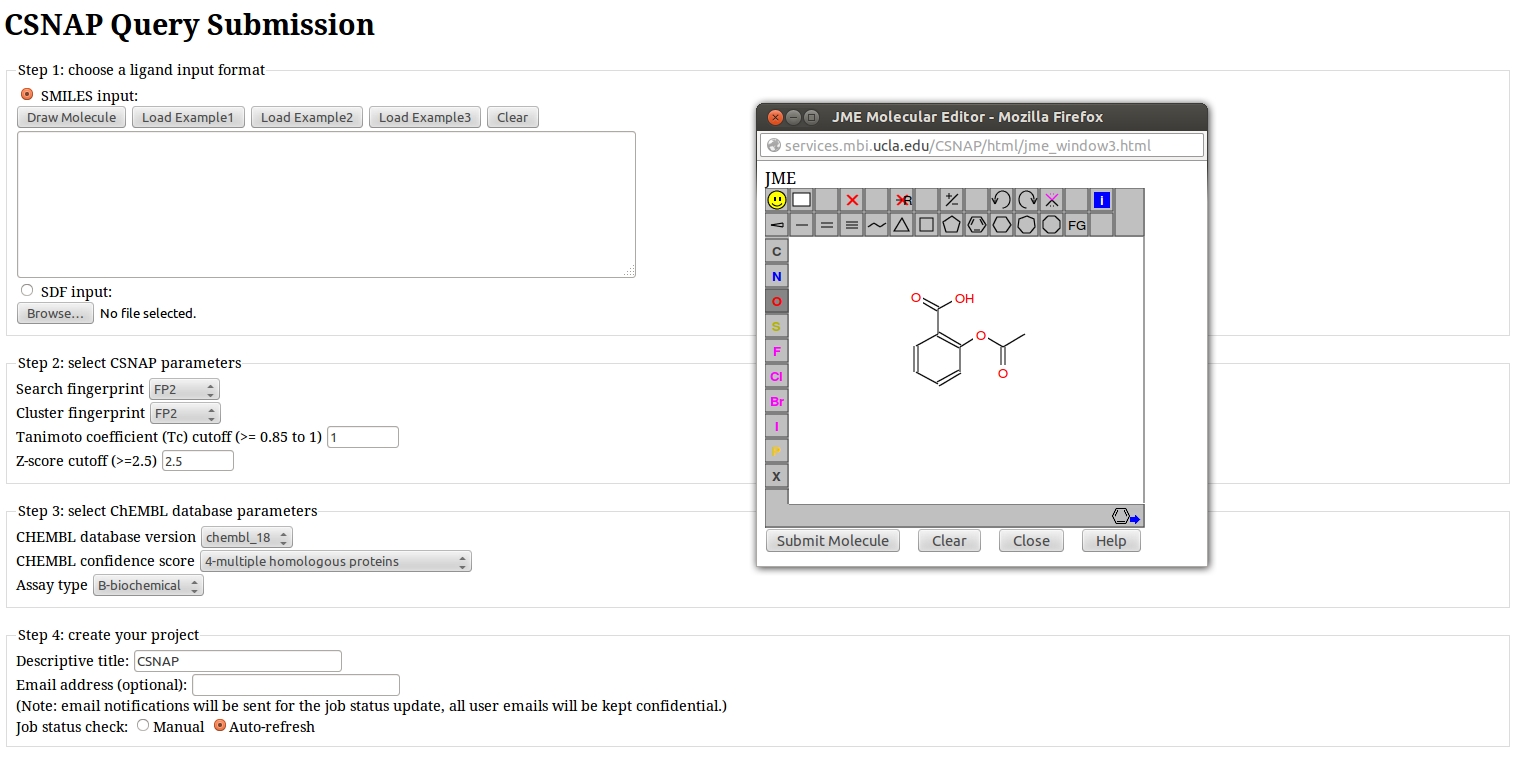
CSNAP accepts two types of inputs representing the structure of small molecule query ligands:
- SDF file format
- SMILES format
Fingerprints:
Molecular fingerprints present each query ligand as a binary sequence of structural features. This faciliates chemical structural comparisons from large compound databases. The fingerprints are used in both the "search" and "cluster" steps. Different types of fingerprints represent different ways of representing ligands into binary sequences:
- FP2
- FP3
- FP4
- MACCS
Chemical Similarity Search:
In CSNAP, chemical similarity comparisons of ligand molecular fingerprints are quantified by two scoring functions: Tanimoto coefficent (Tc) (0-1) and Z-score (>2.5) based on Tc score distribution of the top 100 ranked compounds. A Tc cutoff of 0.85 and a Z-score cutoff of 2.5 generally indicates that two ligands are highly similar and may share common bioactivities.
- Tanimoto coefficent (Tc) cutoff
- Z-score cutoff
ChEMBL Confidence Score:
A confidence score is assigned to each target annotation for ChEMBL compounds as part of the manual curation process from the literature.The confidence score value reflects both the type of target assigned to a particular assay and the confidence that the target assigned is the correct target for that assay. The confidence scores range from 0, for as yet uncurated data entries, to 9, where a single protein target has been assigned a high degree of confidence. Assays assigned a non-molecular target type, for example a cell-line or an organism, receive a confidence score of 1, while assays with assigned protein targets receive a confidence score of at least 4.
- 0-non curated
- 1-non molecular
- 3-non protein
- 4-multiple homologous proteins
- 5-multiple direct proteins
- 6-homologous protein complex subunits
- 7-direct protein complex subunits
- 8-homologous single protein
- 9-direct single protein
ChEMBL Assay Type:
Three types of target annotations are retrieved from the ChEMBL database in CSNAP analyses:
- Binding (B) - Data measuring binding of compound to a molecular target, e.g. Ki, IC50, Kd.
- Functional (F) - Data measuring the biological effect of a compound, e.g. %cell death in a cell line or rat weight.
- ADMET (A) - ADME and Tox data e.g. t1/2, oral bioavailability, LD50.
CSNAP Results Analysis
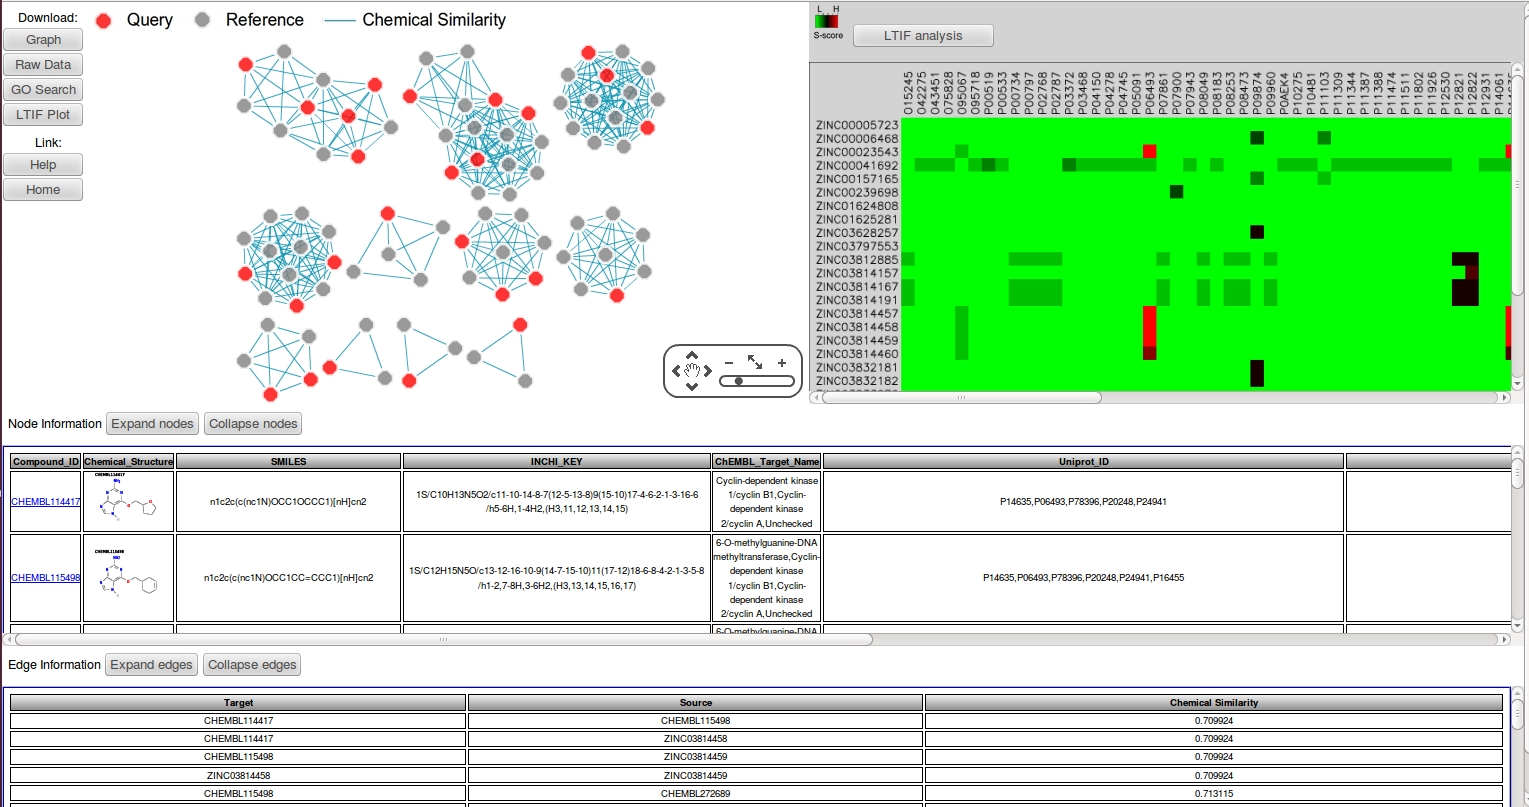
The CSNAP results page consists of five panels:
- Chemical Similarity Networks (CSN)
- Node Information
- Edge Information
- Ligand Target Interaction Fingerprint (LTIF)
- LTIF analysis: LTIF target spectrum and Gene Ontology (GO) Search
Chemical Similarity Networks (CSN)
Both query and reference compounds are ordered into network similarity graphs where nodes represent compounds and edges represent chemical similarity between ligands. To further differentiate between query and reference compounds, the query compounds are labeled by red nodes while the reference compounds are labeled by gray nodes. The nodes and edges can be selected to reveal additional information about the selected compounds.
Right click mouse to access content menu and toggle node and edge labeling.
Node Information
The node information consists of 7 fields:
- Compound_ID (linked to ChEMBL database)
- Chemical_Structure
- SMILES
- INCHI_KEY
- CHEMBL_Target_Name
- Uniprot_ID (linked to Uniprot database)
- CSNAP_Target_Scores
Specifically, the CSNAP_Target_Scores consisting of two scoring functions:
- S-scores (Schwikowski)
- H-scores (Hishigaki)
The predicted targets are ranked according to S-scores in decending order:
Uniprot_ID1:S-score1:H-score1|...|Uniprot_IDN:S-scoreN:H-scoreN|END
The target scores can be used to measure the confidence of the predicted targets of the selected compounds.
Edge Information
The edge information consists of 3 fields:
- Source
- Target
- Similarity
The similarity values repersent the Tanimoto similarity measure between the source and target nodes connecting by the edge.
Ligand Target Interaction Fingerprint (LTIF)
LTIF fingerprint maps the S-scores of all the query compound against all the predicted targets. This results in a heatmap that can be used to identify the off-target activities of the ligands. The color intensity is scaled according to the S-score: from low (green) to high (red).
LTIF analysis
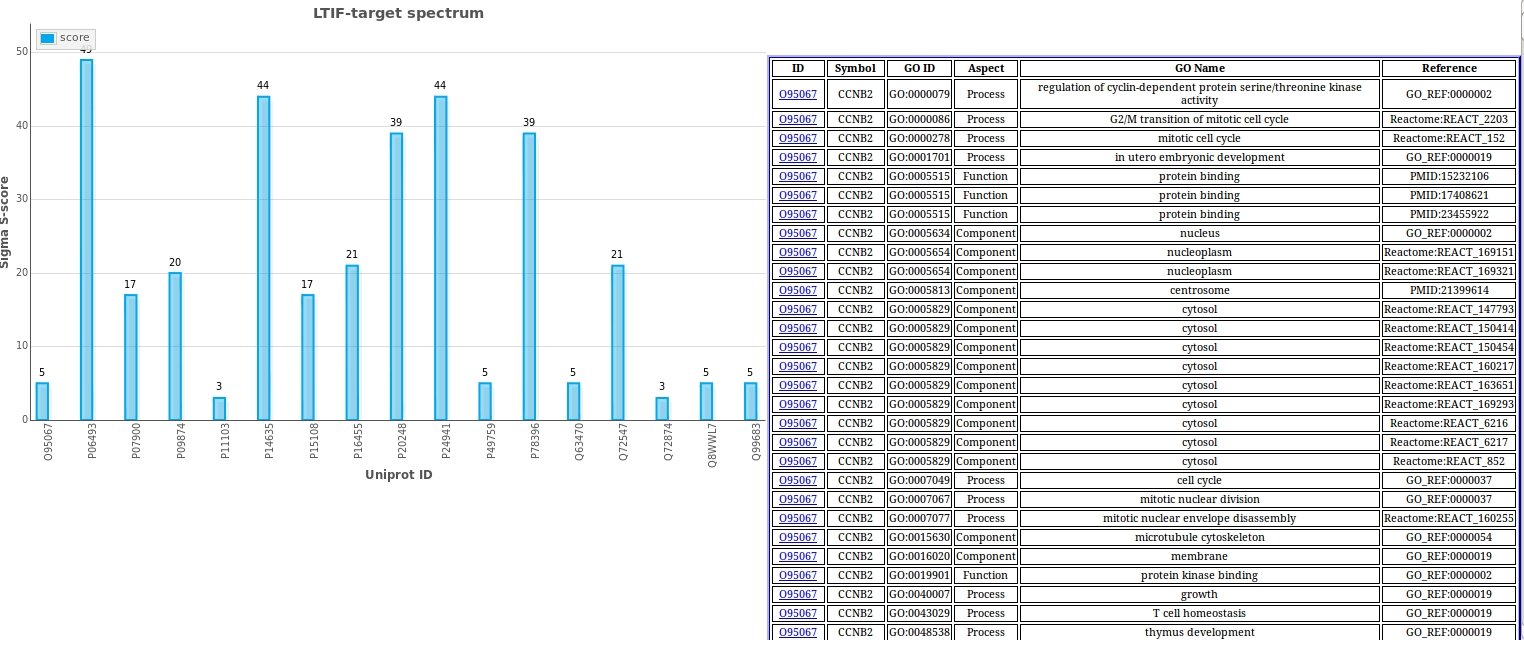
LTIF target spectrum
LTIF target spectrum counts the total S-score as sigma S-score of each target column in the LTIF heatmaps. The plot can be used to determine the target consensus within the compound set and can be used to differentiate major targets from off-targets.
Use the following mouse operation to navigate the plot:
- hover: select
- drag in the x direction: zoom
- cick: restore to default view
Gene Ontology (GO) Target Summary
The Target GO Search consists of 6 fields:
- Uniprot_ID (ID) (linked to the QuickGO database)
- Gene Symbol (Symbol)
- GO ID
- Aspect
- GO Name
- Reference
The Target GO Search panel can be utilized as a post-target prediction and target valiation tool particularly for identifying targets that can induce given phenotypes through known molecular etiology.